
Industrial Devastation To Natural Abundance
The Destruction · Chapter 14
The True Cost
What Agriculture Does Not Put on the Farm Account
Release 1.0 · 2026-09-12
If you use “Listen”, the text of the page may be sent to your browser or operating system’s speech provider, such as Apple, Google or Microsoft, depending on the voice your device uses. Pedaver does not process, transmit or store any audio.
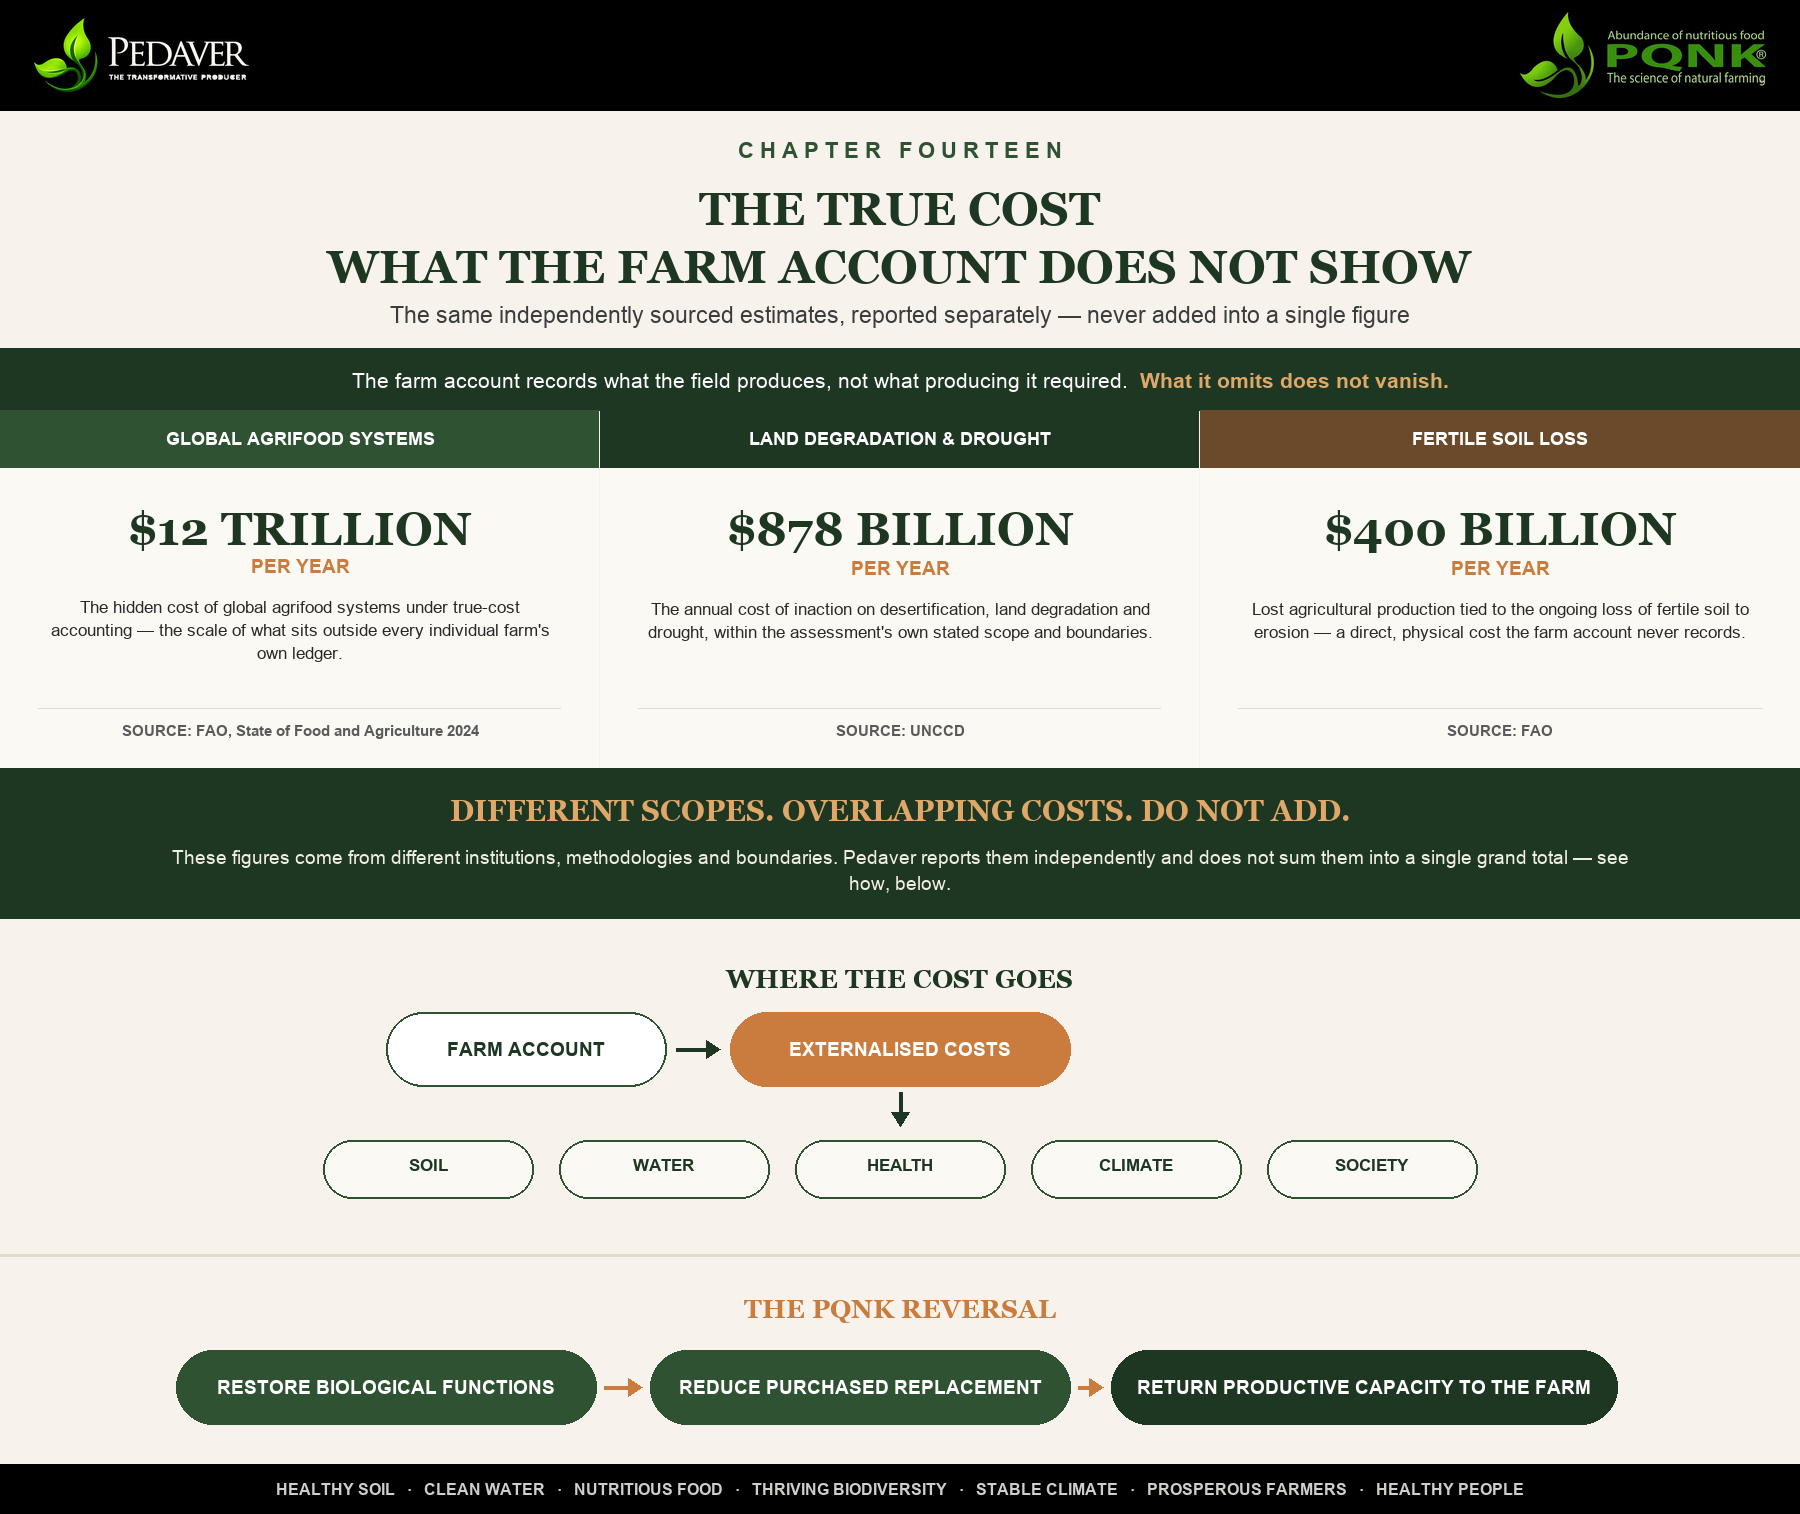
The true cost, what the farm account does not show: the same three independently sourced estimates as Chapter Eleven, reported separately because their scopes overlap; where those externalised costs land, soil, water, health, climate and society; and PQNK’s reversal, restoring biological functions to reduce purchased replacement and return productive capacity to the farm.
“The reason ACI agriculture appears profitable is that it does not pay its bills. The soil pays. The water pays. The farmer pays. The sick person pays. The future pays. The industry collects. Pedaver does not need the biggest number to prove that. It needs the number it can defend.”
Asif Sharif, Lahore, 2026
Every cost described in the six preceding chapters of Part Two, the soil degradation, the water table collapse, the nutritional decline, the biodiversity loss, the climate contribution, the farmer economic collapse, the healthcare burden, the social disintegration, has a monetary dimension. Some of these costs are measured with reasonable confidence by major institutions. Others can only be estimated. A smaller number, the permanent loss of species, the intergenerational consequences of nutritional deficiency, the civilisational risk of permanent aquifer loss, resist reliable monetisation altogether and must be acknowledged as qualitative rather than quantitative.
An earlier version of this chapter attempted to compress all of this into a single figure: a conservative $1.9 trillion in annual cost, a $2.8 trillion restoration dividend, a $4.7 trillion net transformation potential. Those figures have been withdrawn. Source verification found that they combined independent institutional estimates with different scopes, different base years and different definitions, and could not be defended as one additive model. Two of the individual citations behind them could not be traced to any real institutional publication at all. Pedaver does not need the biggest number. It needs the number it can defend. This chapter presents the corrected accounting.
WHAT AGRICULTURE DOES NOT PUT ON THE FARM ACCOUNT
Farm-gate accounting is narrow by design. It counts revenue, purchased inputs, labour and, if the farmer is careful, depreciation on machinery. It does not count what happens to the soil that the farm depletes, the aquifer it draws down, the water it contaminates, the health of the people who eat what it produces, or the atmosphere it loads with carbon. These are real costs of production. They are simply not paid by the producer, and so they never appear on the farm’s own balance sheet.
An externality is an economic cost incurred by a party other than the one making the decision that generates it. When a factory discharges pollution into a river, the factory’s accounts show a profit that does not include the cost imposed on the community downstream. In economic terms, the factory is not truly profitable; it is transferring its costs to others while retaining its revenues. ACI agriculture operates on the same logic, at a scale that dwarfs any single industrial polluter. The input companies that sell fertiliser and pesticide record their revenues as profit. The soil degradation those inputs contribute to is borne by the farmer whose land declines. The water contamination is borne by communities whose groundwater is affected. Diet-related health costs are ultimately borne by households, healthcare systems and society, while many of the production and market forces shaping those diets remain outside the farm account. The climate contribution is borne by everyone, with the heaviest burden falling on those least responsible for it and least equipped to manage its consequences.
This chapter is not an attempt to price every one of those externalities into one number. It is an attempt to show, category by category, where those costs actually land, using the same discipline Chapter Thirteen applied to the seven bankruptcies: measure what can be measured, state its boundaries honestly, and resist the temptation to manufacture false precision out of incompatible estimates.
WHY THERE IS NO SINGLE HONEST GLOBAL TOTAL
Every institution that studies agricultural externalities draws its own boundary around the problem. Some measure the whole global food system, from field to fork to hospital bed. Others measure a narrower slice: soil loss alone, or water alone, or one country’s inaction on land degradation. Some report a single year’s flow of cost. Others report the cumulative cost of decades of inaction, discounted to a present value. Some count only agriculture’s own production costs; others count the downstream food system, including processing, retail and diet.
These differences are not a flaw in the research. They are what any honest measurement of a problem this large has to produce, because the problem itself does not have one natural boundary. The mistake is not in any individual estimate. The mistake is in adding estimates that were built to answer different questions, as though their answers could be stacked into one number.
Pedaver’s governing rule for this chapter, and for every chapter that follows it, is this: estimates from different studies are not added together unless their scopes, base years, geographic coverage and accounting boundaries have first been shown to be compatible. Where that compatibility cannot be shown, figures are reported independently, each with its own source and its own boundary, and the reader is told plainly that they should not be summed. That single rule would have prevented the error this chapter is now correcting, and it governs everything that follows in it.
DOCUMENTED COST WINDOWS
Three independent institutional estimates anchor this chapter. Each is real, each is sourced, and none of them should be added to either of the others.
Global agrifood hidden costs. FAO’s 2024 State of Food and Agriculture report, using true-cost accounting across 156 countries, estimates the hidden costs of global agrifood systems at approximately $12 trillion a year. Roughly $8.1 trillion of that total is associated with unhealthy dietary patterns and their links to non-communicable disease. This is a food-system estimate, covering everything from field to plate, not a measure of farming alone, and it should not be read as agriculture’s bill in isolation.
Land degradation and drought. UNCCD’s current financial-needs assessment estimates approximately $878 billion a year in the cost of inaction from desertification, land degradation and drought across the selected countries included in its analysis. Because this figure comes from one coherent methodology, its own internal components can legitimately be read together: approximately $308 billion attributed to drought, $302 billion to productivity change associated with biome transitions, $159 billion to agricultural productivity losses from erosion and declining soil fertility, and $110 billion to climate damage associated with soil-organic-carbon emissions.
Fertile soil loss. FAO separately reports that approximately 75 billion tonnes of fertile soil are lost to erosion annually, representing around $400 billion in lost agricultural production. This is the one figure from the chapter’s earlier draft that held up cleanly under source verification, and it is retained here on that basis.
These three windows measure different, overlapping dimensions of the same underlying problem. Read together, these estimates establish something more important than any manufactured total could: the economic burden associated with degraded land, food-system externalities and agricultural decline is measured in trillions of dollars, depending on where the analytical boundary is drawn.
THE DIFFERENCE BETWEEN FARM COST AND SOCIAL COST
Two production systems can sell the same commodity into the same market at the same price and carry entirely different total costs. One has paid for repeated tillage, synthetic fertiliser, pesticide, large irrigation volumes and the machinery to apply all of them; its farm-gate accounts show a reasonable margin, because none of the soil, water or health cost it generates appears on those accounts. The other has progressively removed those costs by restoring the biological functions that once performed them for free. Both may report similar profitability at the farm gate. Only one of them is actually cheap.
This is the sense in which ACI agriculture can be, in aggregate, the most expensive food-production arrangement in human history while still appearing profitable to the individual producer. The apparent efficiency of the prevailing system depends on costs that are real, that are paid by someone, and that simply do not appear in the account of the party generating them. True Cost Accounting exists to correct that: not by inventing a single number, but by insisting that soil depreciation, water depletion, pollution and health externalities be counted somewhere, by someone, before a production system is called efficient.
THE RESTORATION SIDE
The earlier version of this chapter proposed a $2.8 trillion global “PQNK Restoration Dividend,” built from a region-by-region table with no verifiable institutional source behind any of its splits. That table has been withdrawn. In its place, this chapter uses real, independently documented restoration economics, without attributing a manufactured global dollar figure to PQNK itself.
UNCCD reports that restoring 150 million hectares of degraded agricultural land could generate approximately $85 billion in net benefits to national and local economies, including roughly $30–$40 billion a year in additional income for smallholder farmers, alongside improved food security for nearly 200 million people. This is not a claim about PQNK specifically. It demonstrates, from an independent institutional source, that restoration has a real and measurable economic direction, at a scale that makes the case for investing in it without requiring anyone to trust an unverifiable global total.
WHERE PQNK ENTERS THE ECONOMICS
PQNK’s own economic case does not rest on a projected global dividend. It rests on documented reductions in the specific costs a farm actually carries. The NARC wheat trial, discussed in Chapter Twelve, recorded a fifty-eight percent reduction in cost of production in the first PQNK season against conventional drill seeding, with a seed rate roughly a twentieth of the conventional rate. Across PQNK’s field record more broadly, the recurring pattern is the same: lower purchased-input dependency as biological nutrient cycling and pest regulation re-establish themselves; lower energy demand as pumping and mechanical operations decline; lower irrigation requirement as restored soil structure and permanent cover increase infiltration and water-holding capacity; less need for corrective intervention as the underlying biological system stabilises; and, as these functions recover, improved resilience to climatic stress and improved produce quality. Each of these is a cost the farm currently pays to replace a function nature would otherwise perform. PQNK’s argument is that restoring the function is cheaper than continuing to pay for its replacement.
PAKISTAN: WHERE EXTERNALISED COST BECOMES FARM REALITY
Global figures describe a system. Pakistan’s own numbers describe what that system does to one country in real time, and none of them need to be folded into another manufactured total to make the point.
Pakistan’s food import bill runs to approximately $9 billion a year (FAO), a dependency that widens whenever the rupee weakens or global commodity prices rise, and it sits inside a broader national energy-and-food import bill of roughly $55 billion, a figure that has nothing to do with agriculture specifically but sets the fiscal backdrop against which every additional agricultural input import is weighed. As Chapter Eleven set out, Pakistan’s Economic Survey 2024–25 recorded a 14.1 percent year-on-year fall in fertiliser nutrient offtake during July–March FY2025, driven primarily by subdued wheat prices rather than by any improvement in soil biology, evidence of how directly farm-level input decisions track price and policy shocks that have nothing to do with the condition of the soil.
The same import dependency compounds through water. As Chapter Eleven also set out, groundwater levels across the heavily pumped areas of the Indus Basin are declining and pumping lifts are rising, which means the energy cost of lifting irrigation water climbs with every metre the water table falls, a cost carried by the same farmer whose fertiliser and pesticide bill is already exposed to global price and exchange-rate movements.
None of this needs a constructed Pakistan-specific dollar total to make its point. A production system with a rising, compounding requirement for purchased fertiliser, purchased pesticide, purchased diesel and increasingly deep, increasingly expensive irrigation water is a production system whose margin is increasingly determined by decisions made outside Pakistan, and outside the farm. The NARC wheat trial discussed earlier in this chapter and in Chapter Twelve, a fifty-eight percent reduction in cost of production against conventional drill seeding, is significant for exactly this reason: it is evidence, from an institution applying its own procedures under Pakistani field conditions, that this exposure is not fixed. It is a structural feature of the production system in use, and it changes when the production system changes.
FROM SUBSIDISING INPUTS TO FINANCING INDEPENDENCE
Public agricultural spending in Pakistan, as in most of the world, is concentrated on subsidising the inputs a farmer must buy each season: fertiliser, and in various forms, fuel, credit and seed. That spending keeps the current system running. It does not reduce the farmer’s exposure to it, because a subsidy on an input the farm depends on this season is still a payment toward the same dependency next season.
The alternative is not to withdraw public support. It is to redirect it toward reducing the dependency itself. Public investment can finance the machinery a transition actually requires, hardpan-breaking and permanent-bed-forming equipment, precision no-till planters, at a scale individual farmers cannot afford alone; it can fund the training and extension needed to run a biological system rather than an input-response one; and it can pay for the independent measurement, soil organic matter, water use, purchased-input volume, yield and nutritional quality, that lets a transition be verified rather than taken on trust. None of this requires estimating what the transition is worth in advance. It requires financing the specific, identifiable costs of the transition itself, and then measuring what comes back.
This is the same distinction the rest of this chapter has drawn between a manufactured total and a documented one, applied to policy. A government that subsidises fertiliser is financing dependency. A government that subsidises the equipment, training and measurement a farm needs to reduce its own input requirement is financing the farm’s independence from the subsidy itself, the only kind of agricultural support that, if it succeeds, eventually becomes unnecessary.
WHAT MUST BE MEASURED UNDER PQNK
None of the claims in the preceding section are self-certifying. Each has to be measured, on real farms, over enough seasons to separate a genuine transition from a single good year. The relevant measurements are yield, water use, energy use, purchased-input volume, labour requirement, nutritional density, produce quality, net return, the cost of the transition itself, and the speed at which restoration actually occurs under different soils, crops and climates. This is a longer and more demanding list than a single headline dividend, and that is the point: a system’s economic case is only as strong as the discipline with which it is measured, and PQNK’s case is built to be tested against exactly these categories, crop by crop and farm by farm, rather than accepted on the strength of one number.
THE REAL DIVIDEND
The true economic advantage of PQNK is not that it promises a predetermined global dividend. It is that it removes costs at their source by restoring functions that agriculture currently pays industry, governments and future generations to replace. The dividend is not a dollar figure to be projected and defended. It is the transfer of productive capacity back to the farm: soil that builds its own fertility, water that the field captures and holds rather than needing to be pumped, pest regulation the ecosystem performs rather than a chemical programme, and a producer whose margin no longer depends on a purchased input arriving on schedule at an affordable price.
WHAT THIS CHAPTER HAS ESTABLISHED
This chapter has replaced a manufactured global total with three documented, independently sourced cost windows, FAO’s agrifood-system estimate, UNCCD’s land-degradation estimate and FAO’s soil-loss estimate, each reported within its own boundary and none of them summed with the others. It has shown why farm-gate profitability can coexist with a much larger social cost, and why PQNK’s own economic case rests on documented, measurable reductions in specific costs rather than on a projected dividend. The conclusion is narrower than the one this chapter originally offered, and stronger for being narrower: the cost of the prevailing system is real and immense, however it is measured, while PQNK’s economic case should be documented crop by crop, farm by farm and season by season through measurable reductions in water, energy, purchased inputs and production cost, together with yield, quality, nutrition and resilience.
Chapter Fifteen: Human Civilisation and the Politics of Food, Agriculture, Power, and the Future of Autonomy